Ticket Reports
Ticket Reports
Updated March 24, 2026
Overview
Remmy includes built-in reports for tracking help desk activity over time. These reports help sysadmins understand ticket trends, workload distribution, and resolution performance.
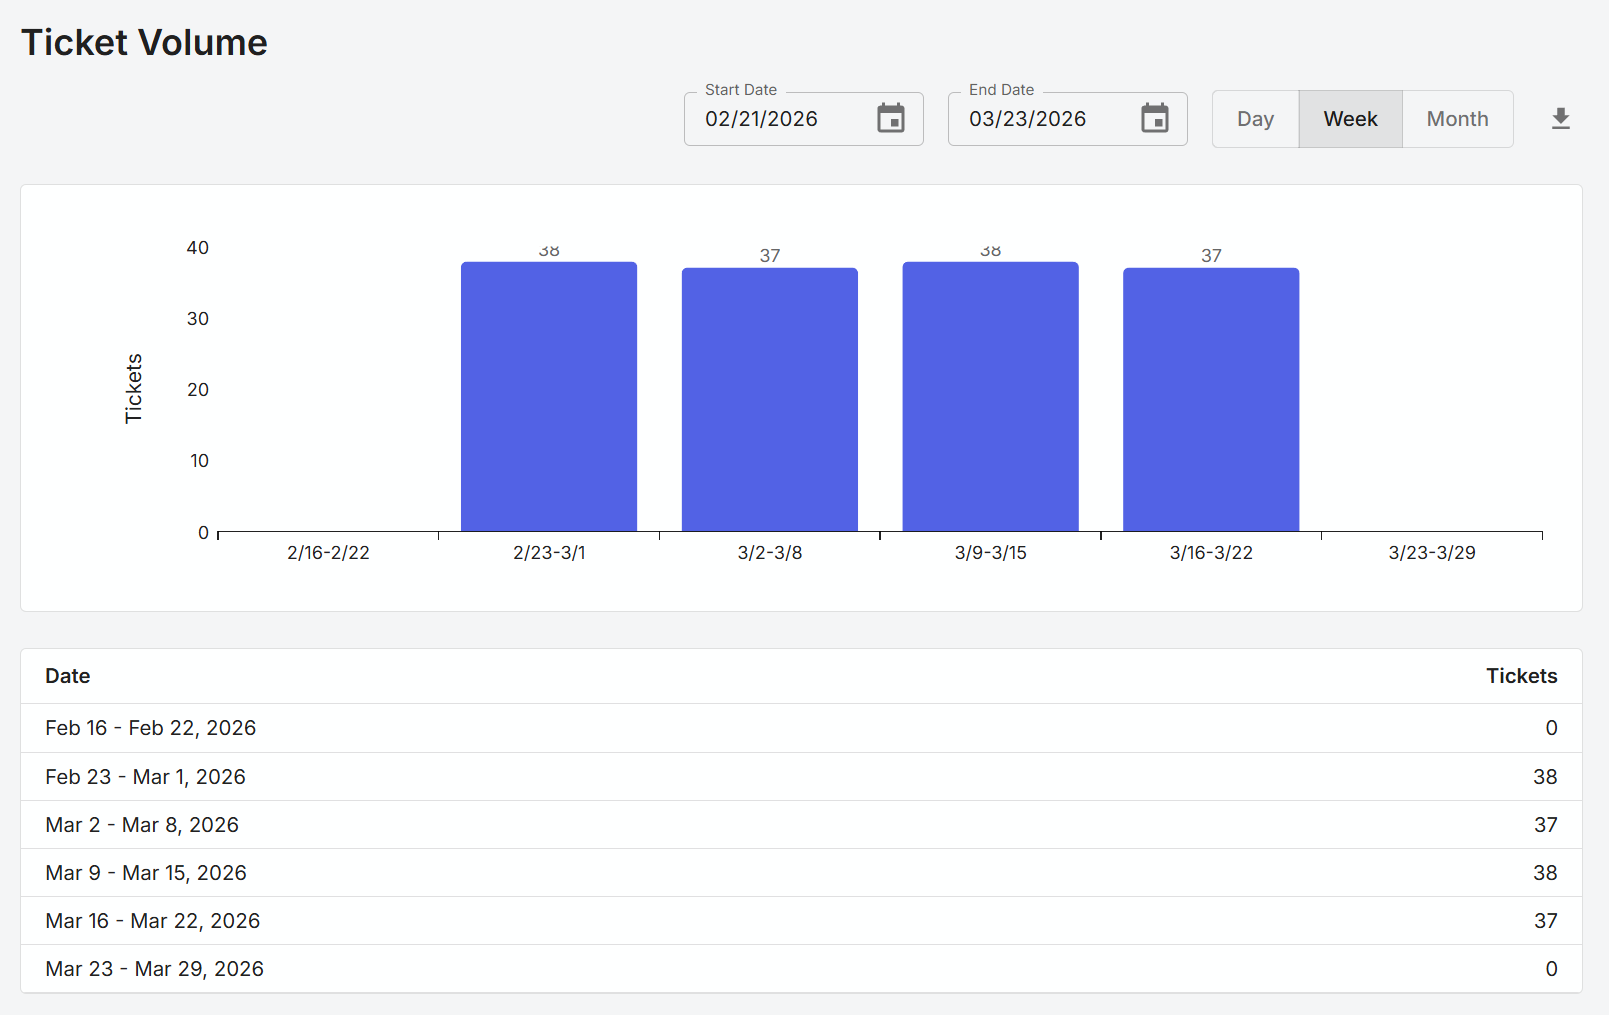
Ticket volume
The Ticket Volume report shows a count of tickets created in the specified date interval (day, week, month). This is not the number of tickets closed or currently open - it shows tickets created regardless of the current status.
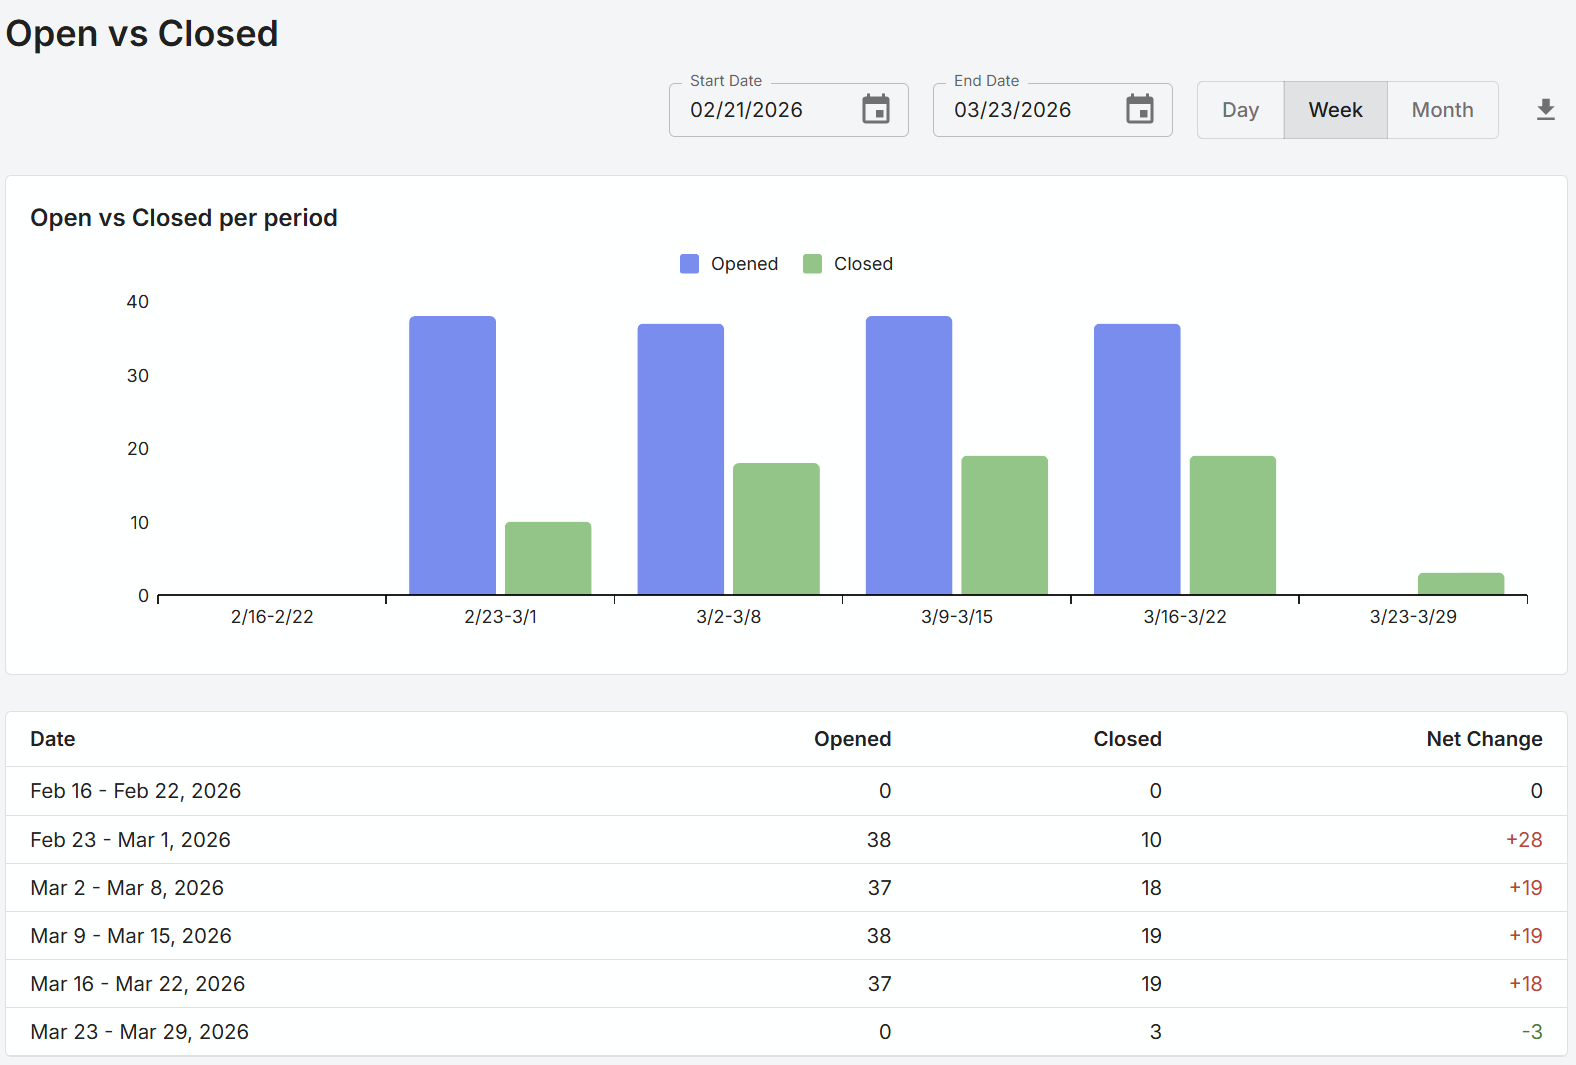
Open vs closed tickets
The Open vs Closed ticket report shows the number of tickets created, and the number of tickets closed, for the selected time interval. This report can be useful in identifying how the team is doing at closing out tickets relative to the rate in which new tickets are being created.
The closed tickets are based on the close date, not the created date of the ticket, and may not be the same tickets as those shown as created.
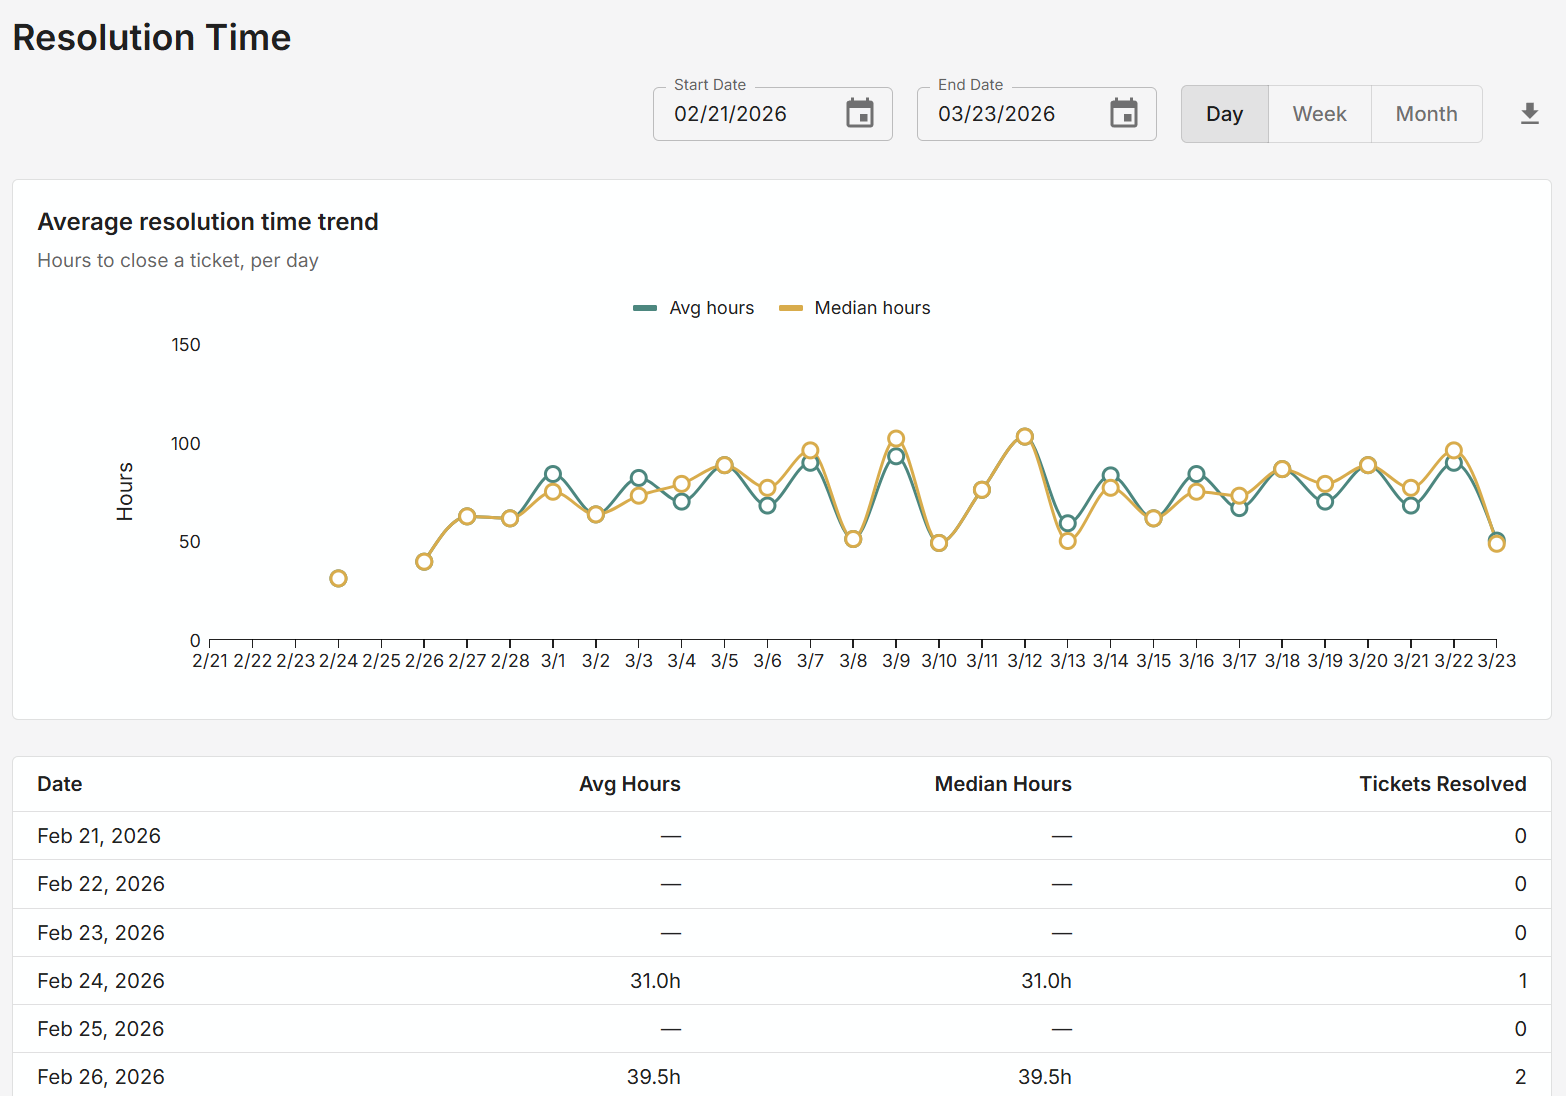
Resolution time report
The Resolution Time report shows how many hours tickets that were closed during the time range and date interval took on average and the median to be closed. The date range is not for when the ticket was created, but for when it was closed.
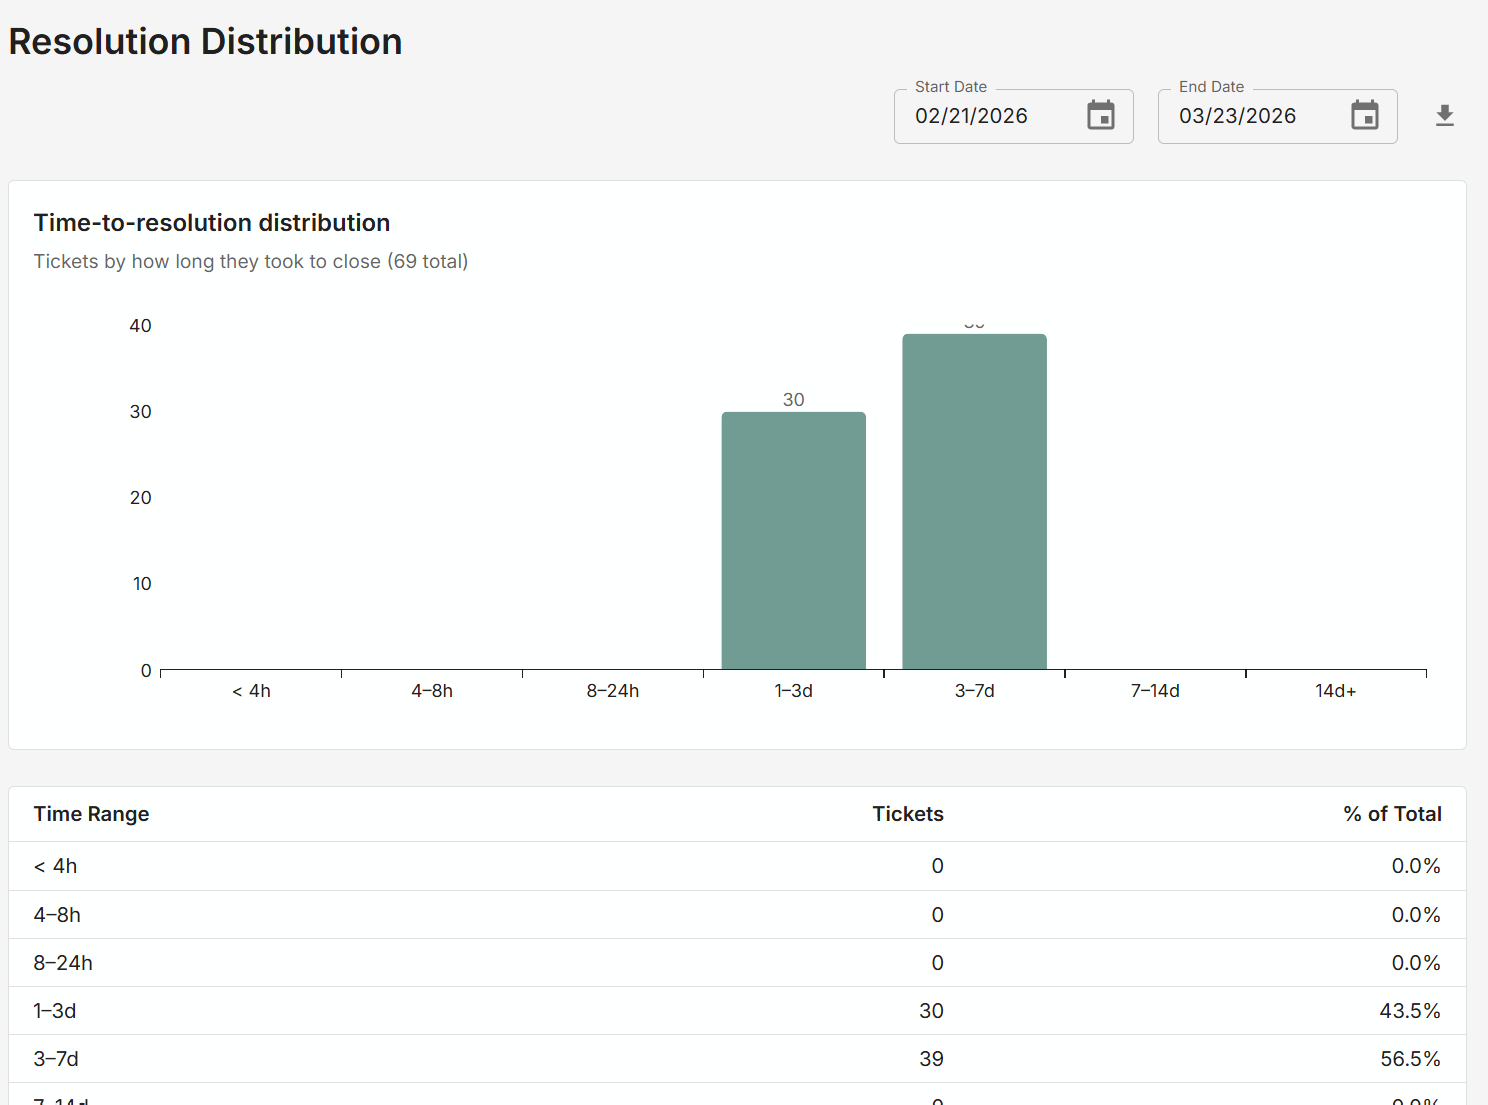
Resolution distribution
The Resolution Distribution report shows for the selected date range, a count of tickets that were closed during that date range, grouped by how long the ticket was open before it was closed.
The date range is based on when the ticket was closed, not when it was created.
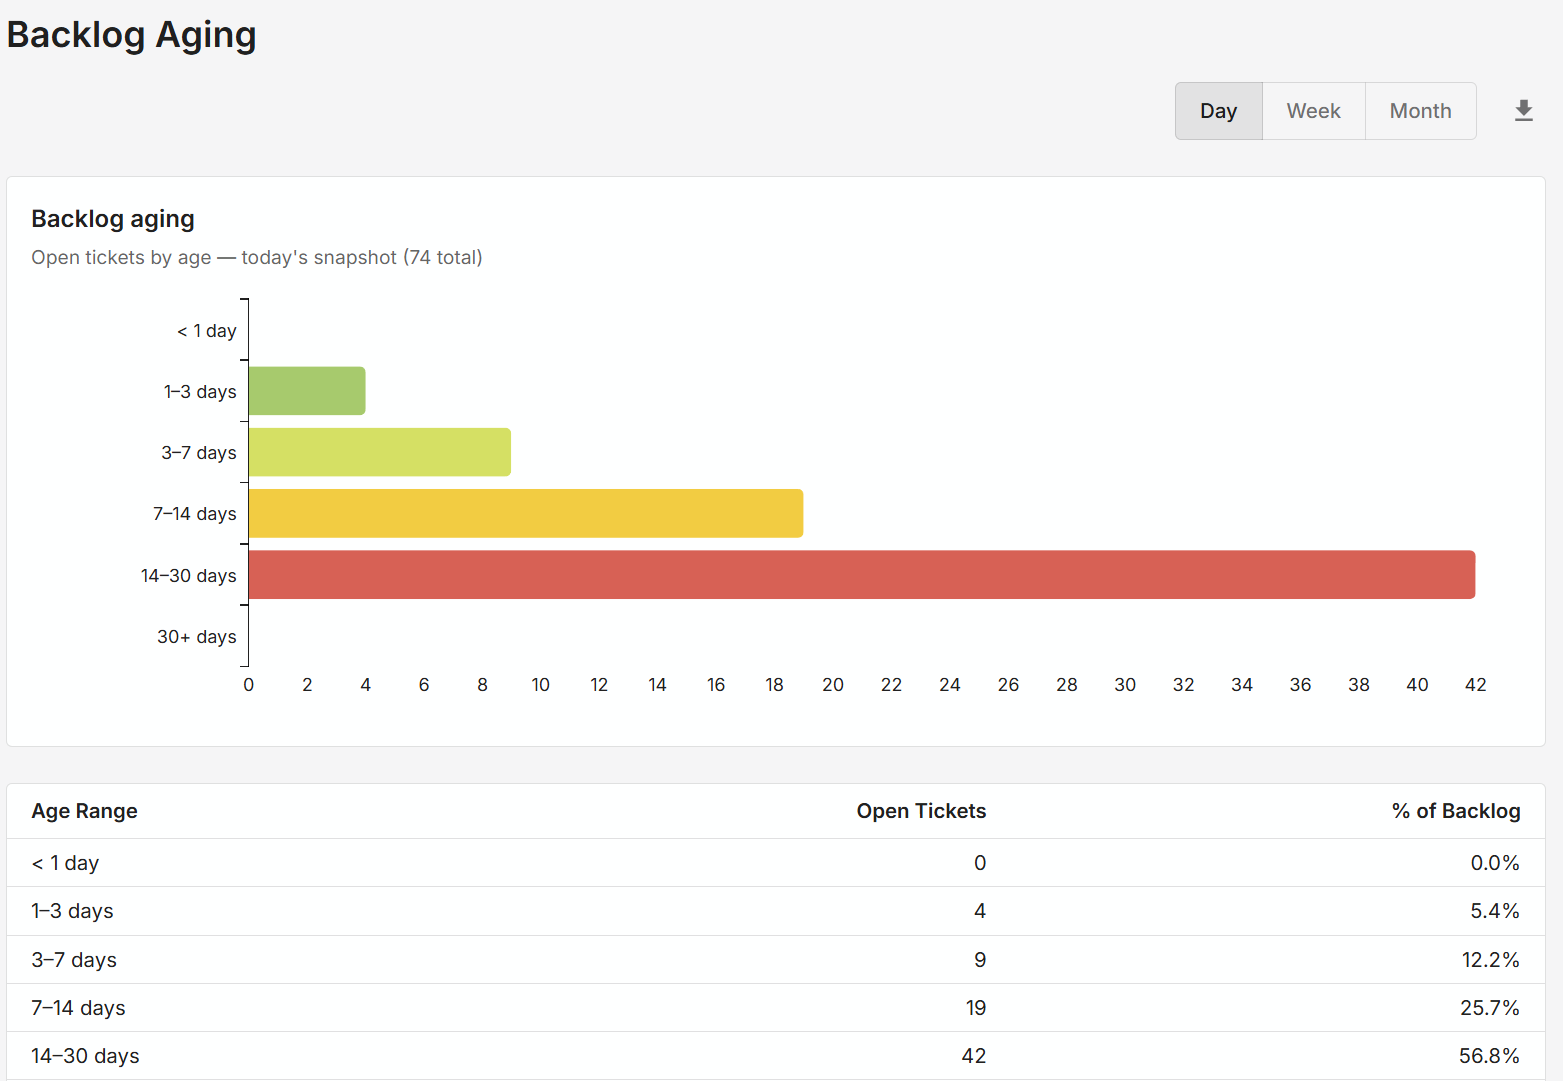
Backlog aging
The Backlog Aging report shows for the currently open tickets, how many tickets have been open for less than one day, 1-3 days, 3-7 days, etc. This report can be helpful in triaging the current backlog.
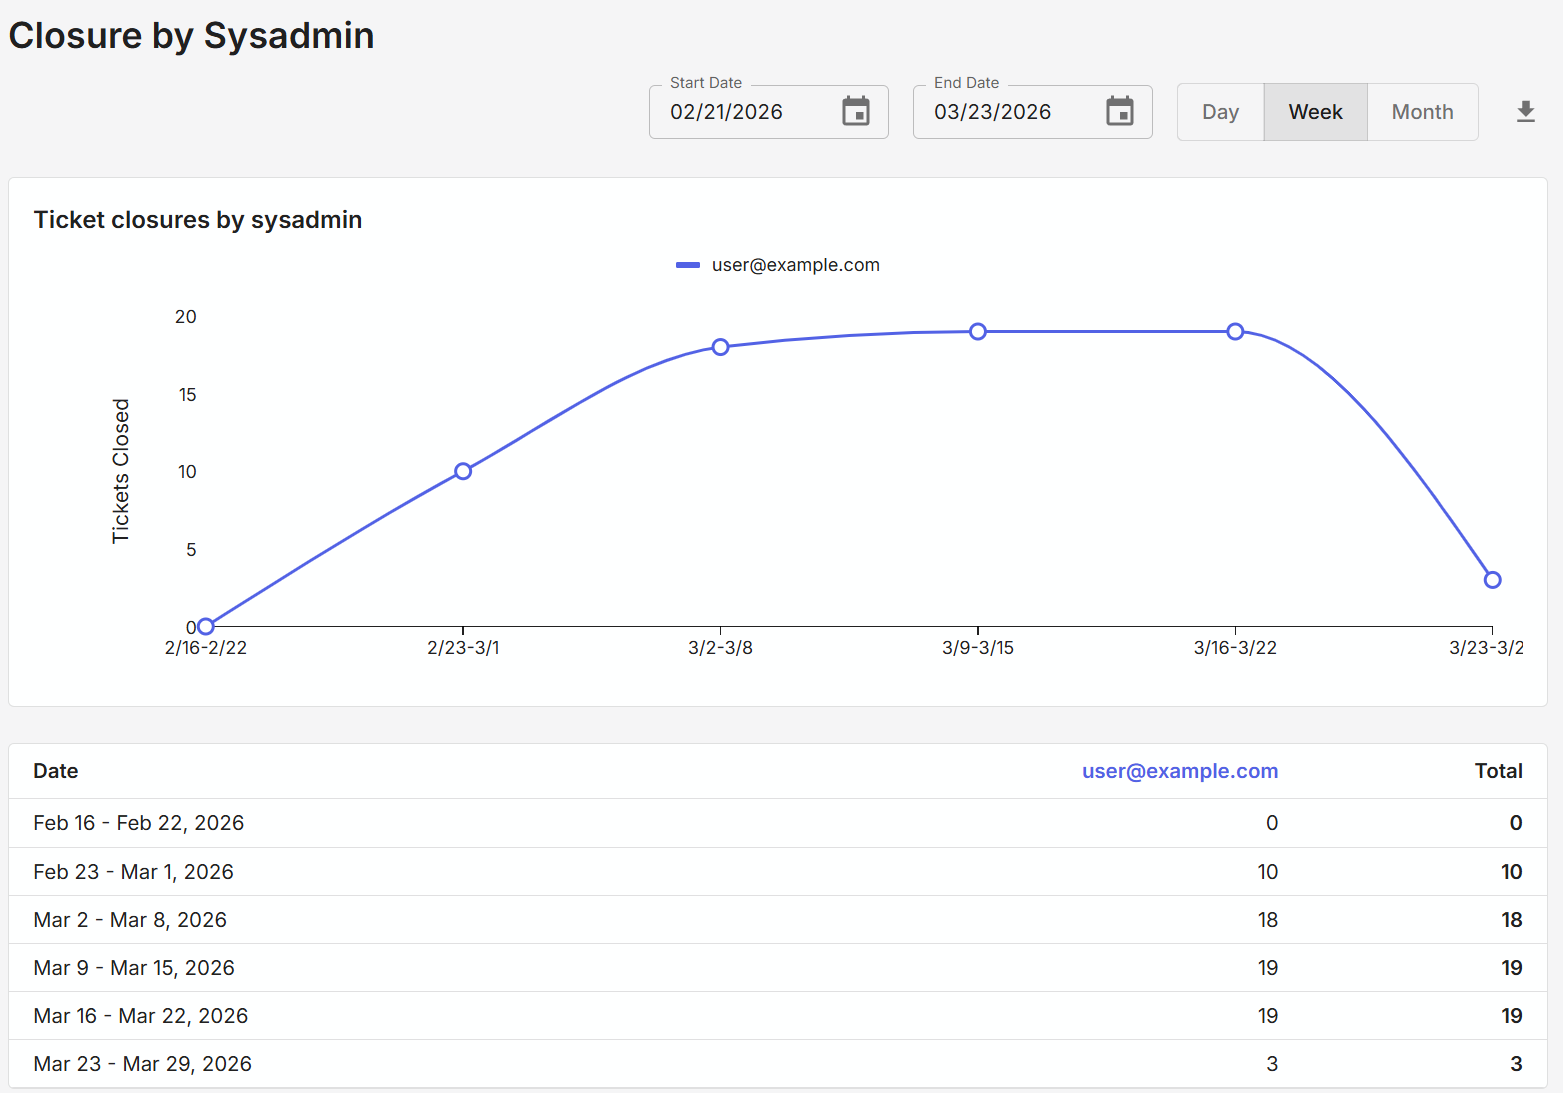
Closure by sysadmin
The Closure by Sysadmin report shows the number of tickets closed by assignee over the specified date range and time interval. Each user is shown as a different line on the graph, and each user has a column in the table showing a count of tickets closed in that time range and interval.